
Data Kit for Creators & Journalists
Asylum court data, ready to use
Free to use in videos, posts and articles. Keep the source line and the numbers as they are. Updated every month.
Charts
Download the charts
How to credit
One line is all we ask
Data: AsylumTracker (asylumtracker.com), based on official EOIR immigration-court records, as of Oct 1, 2026.
- Keep the source line on the image, or put the line above in your caption or description.
- Do not change the numbers. You may crop, translate the titles or recolor the chart.
- Past grant rates describe history, not anyone's chances; please do not present them as predictions or legal advice.
Key numbers
The numbers behind the charts
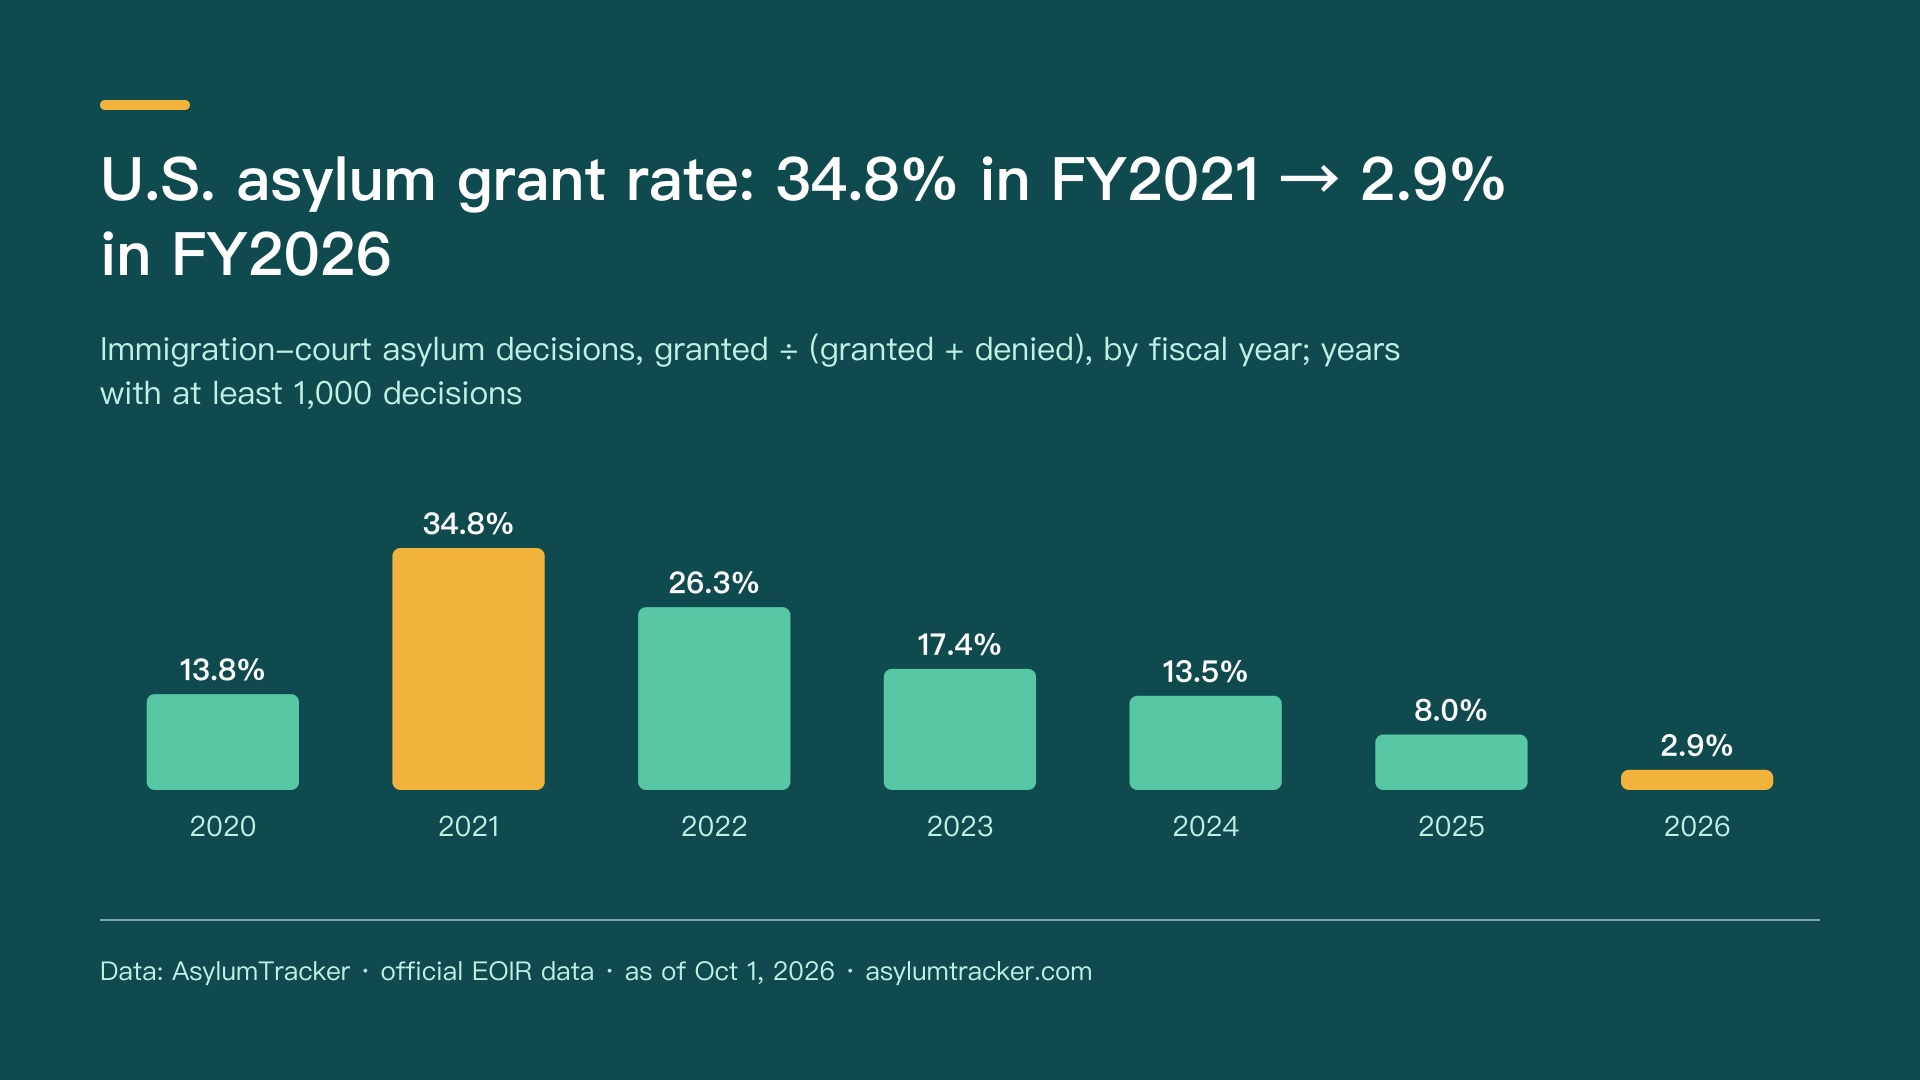
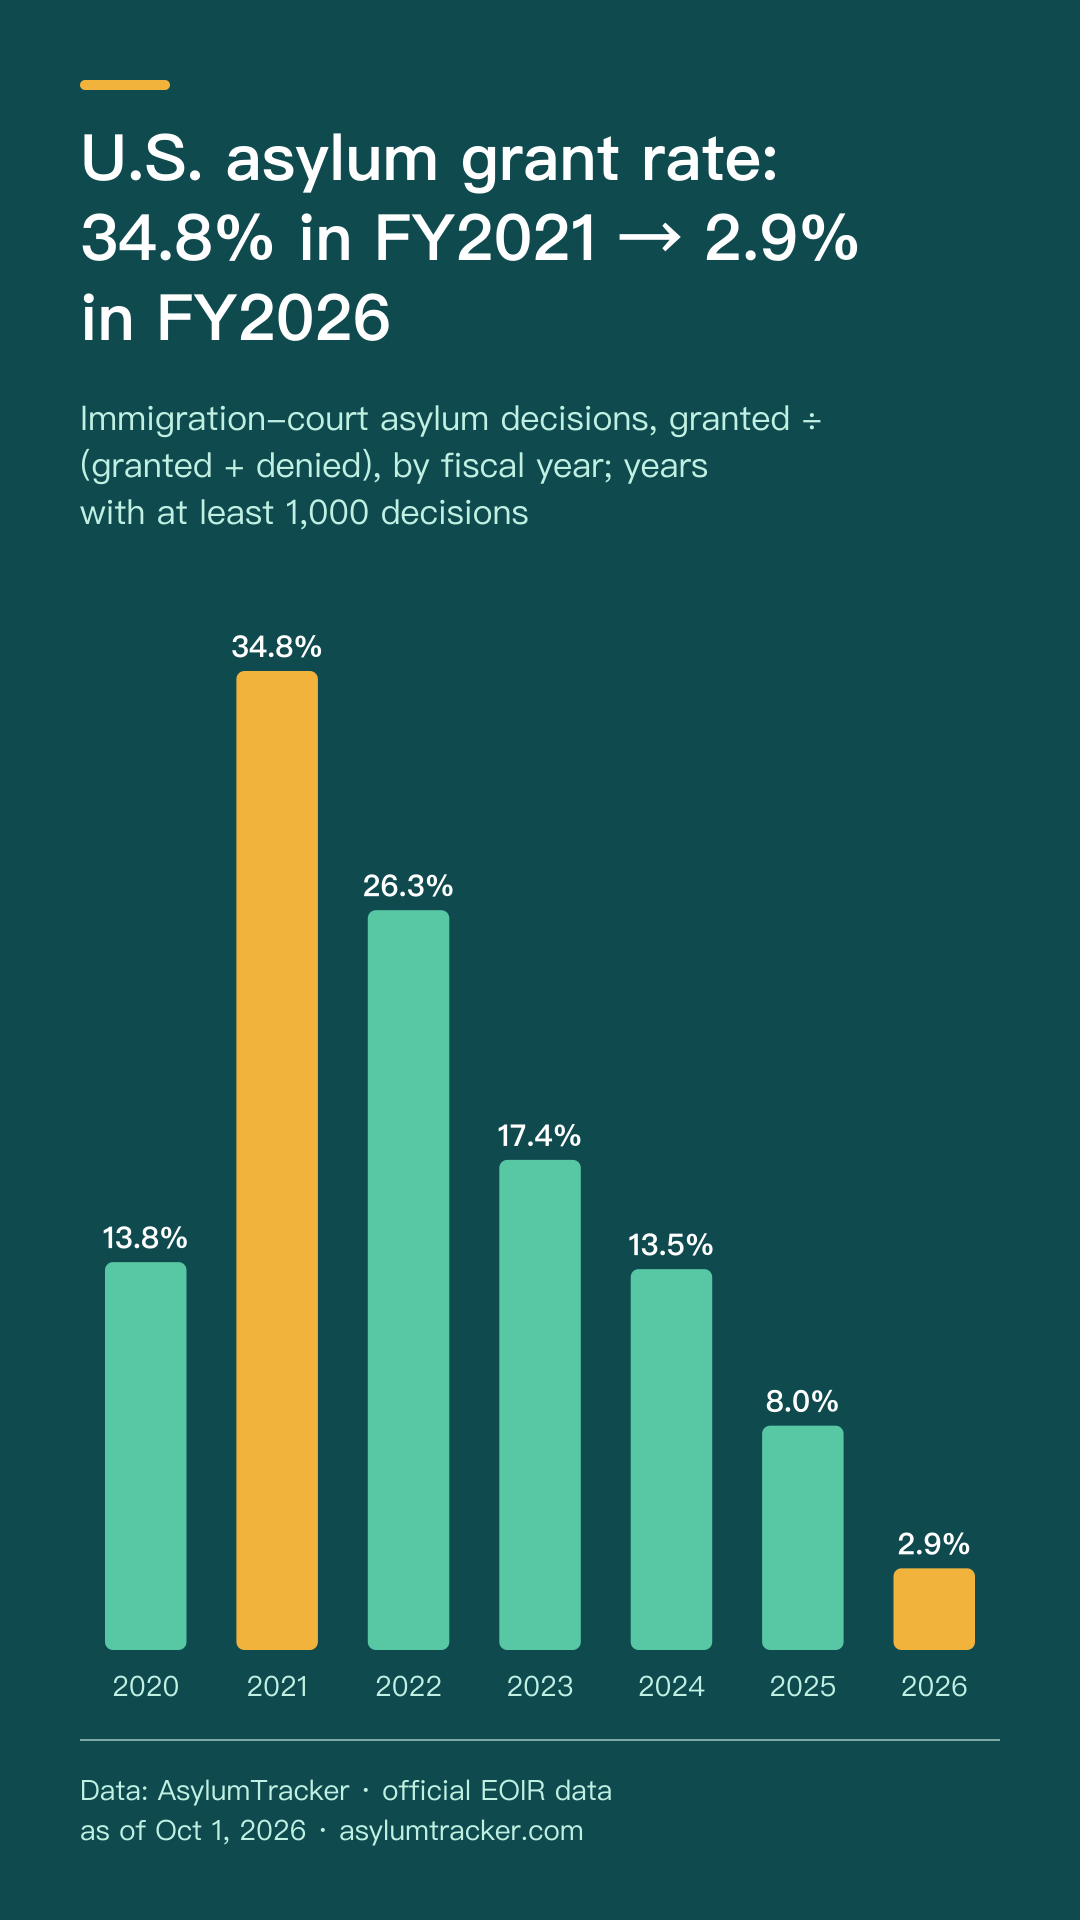
- U.S. asylum grant rate: 34.8% in FY2021 → 2.9% in FY2026
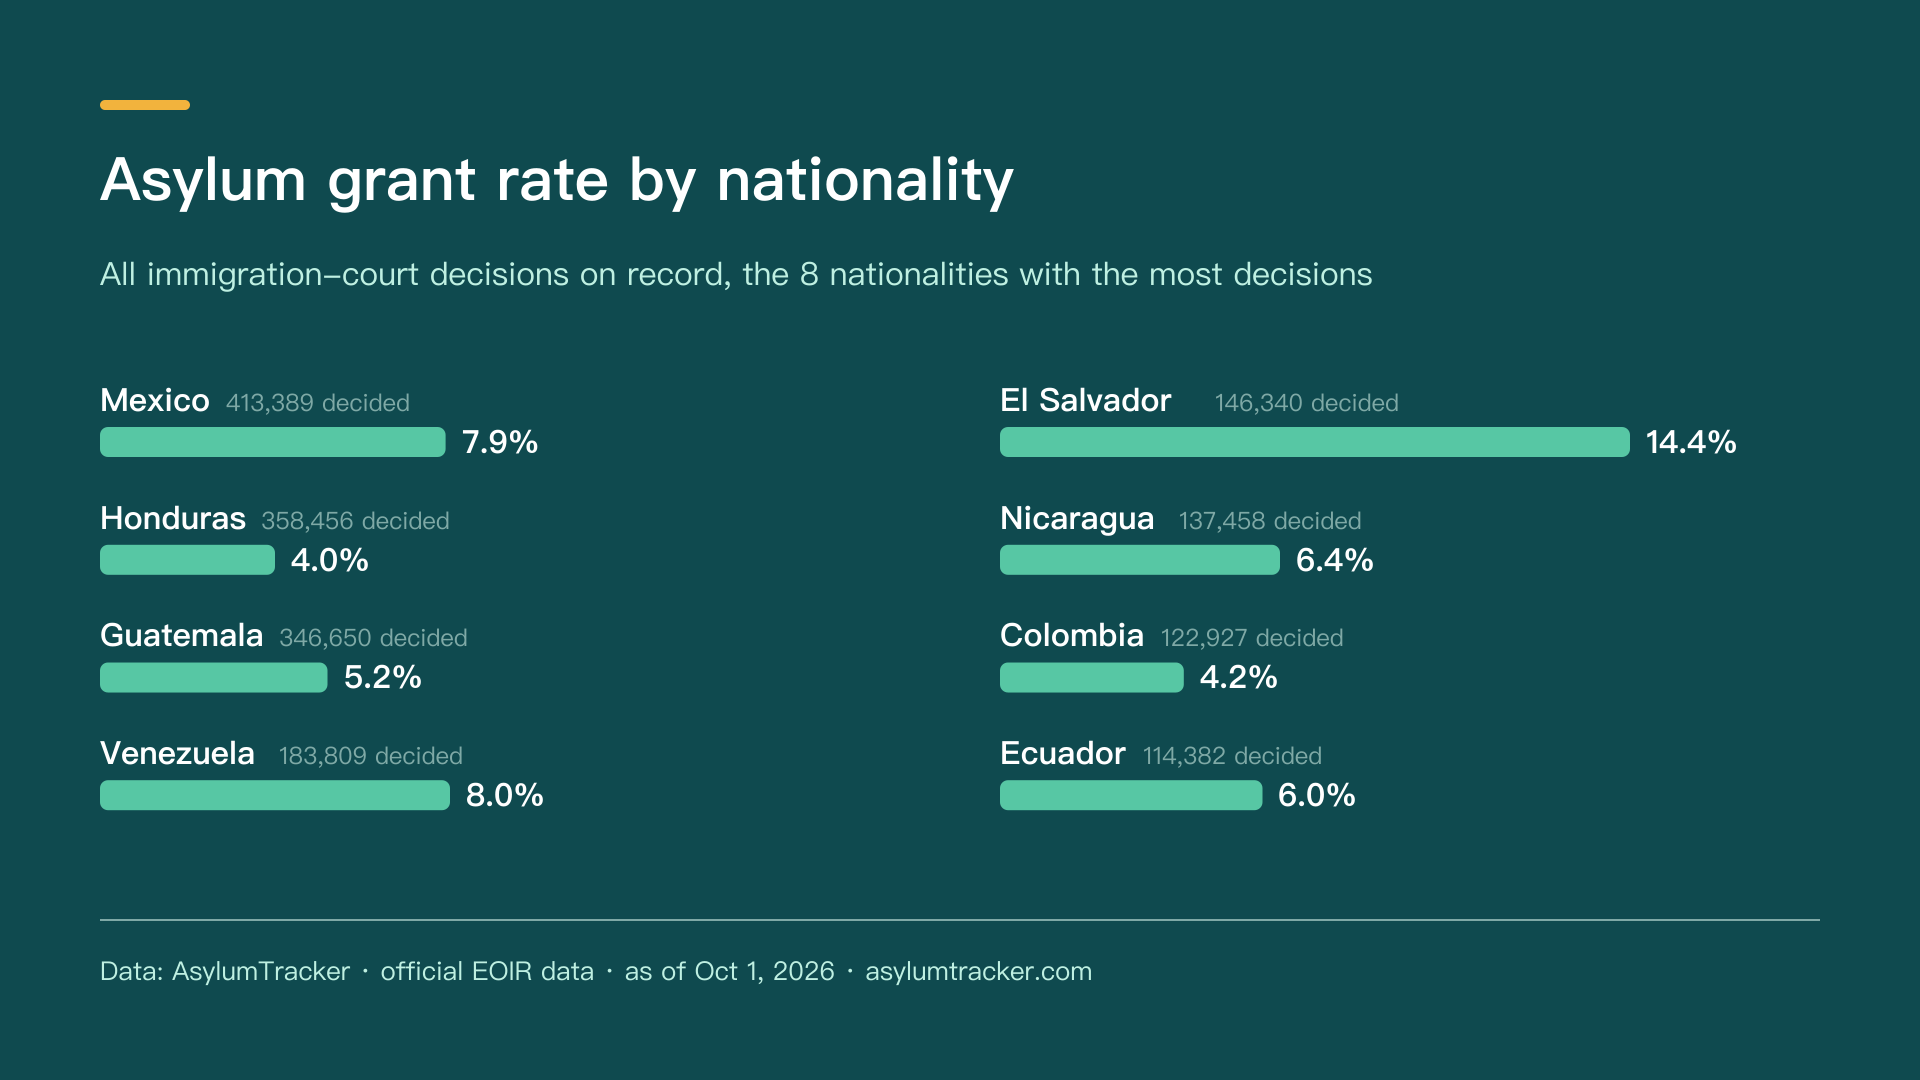
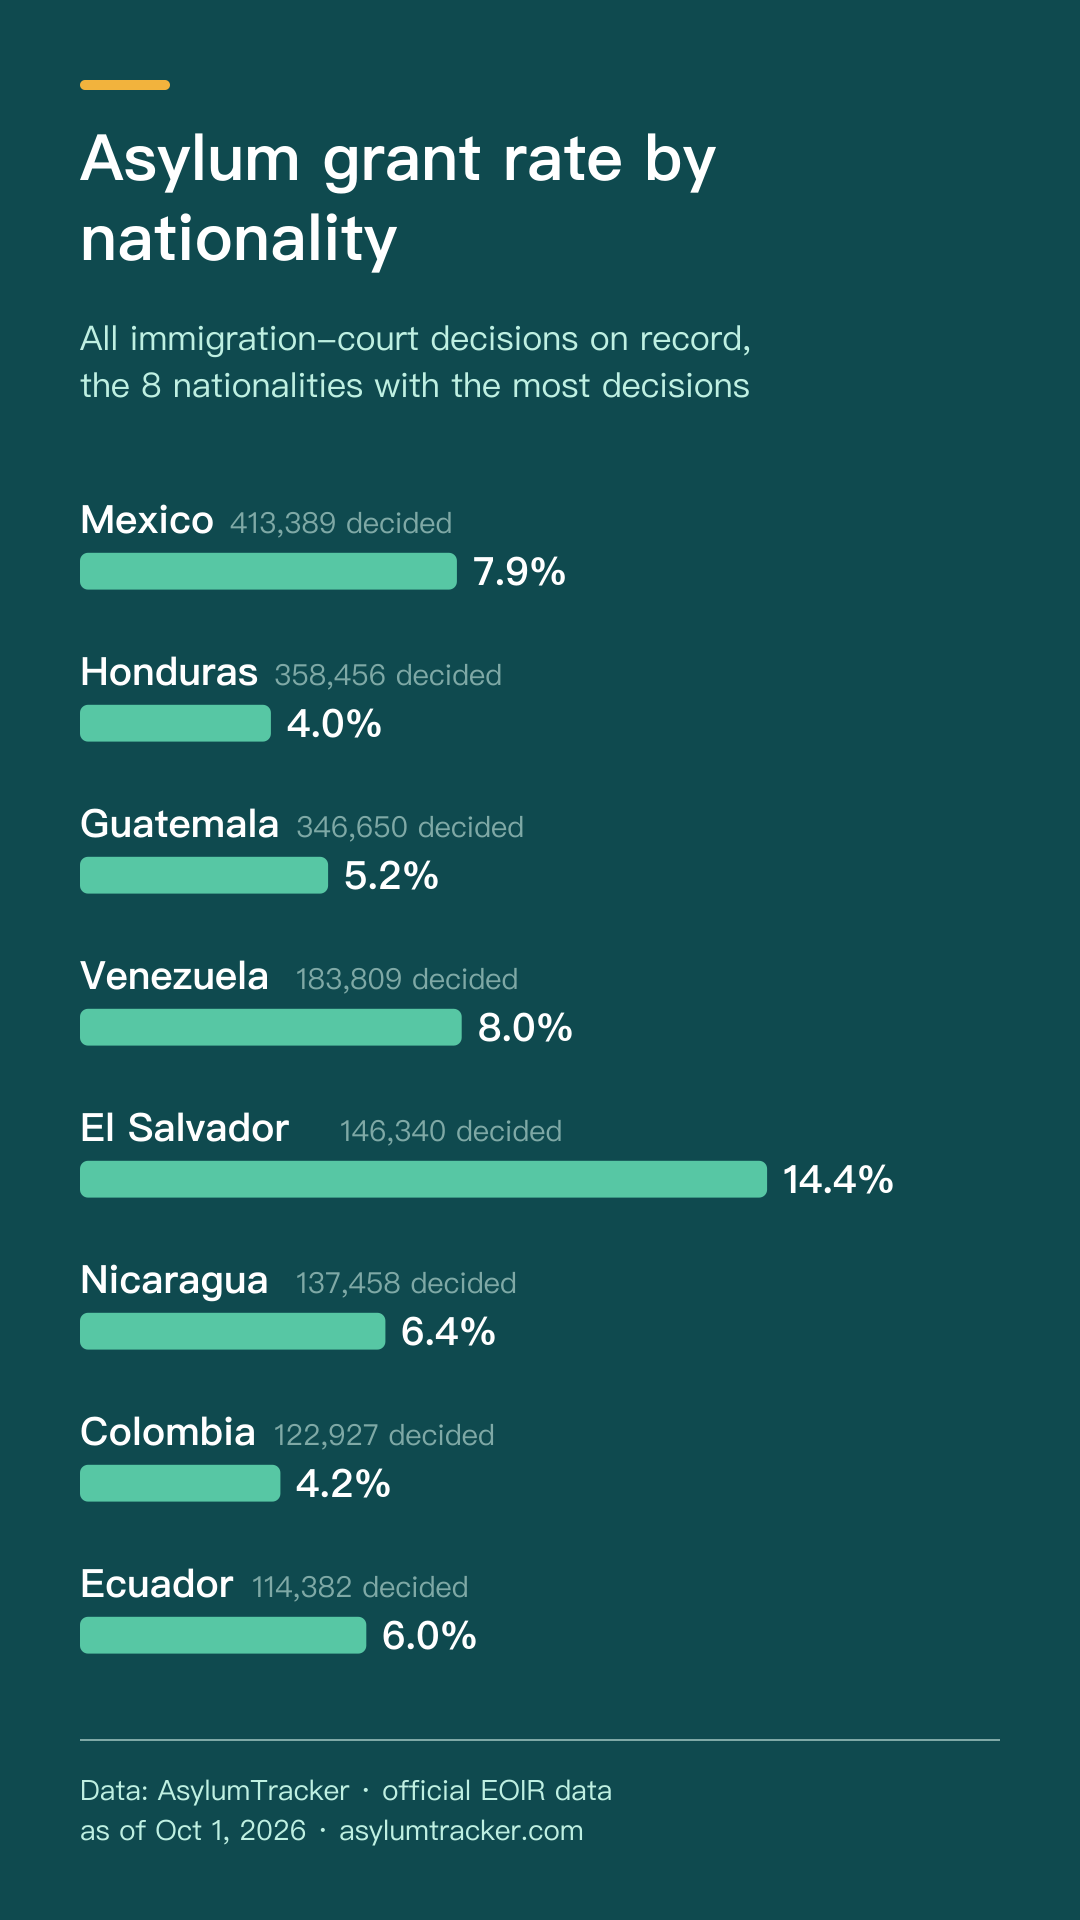
- Asylum grant rate by nationality: Mexico 7.9%, Honduras 4.0%, Guatemala 5.2%, Venezuela 8.0%, El Salvador 14.4%, Nicaragua 6.4%, Colombia 4.2%, Ecuador 6.0%
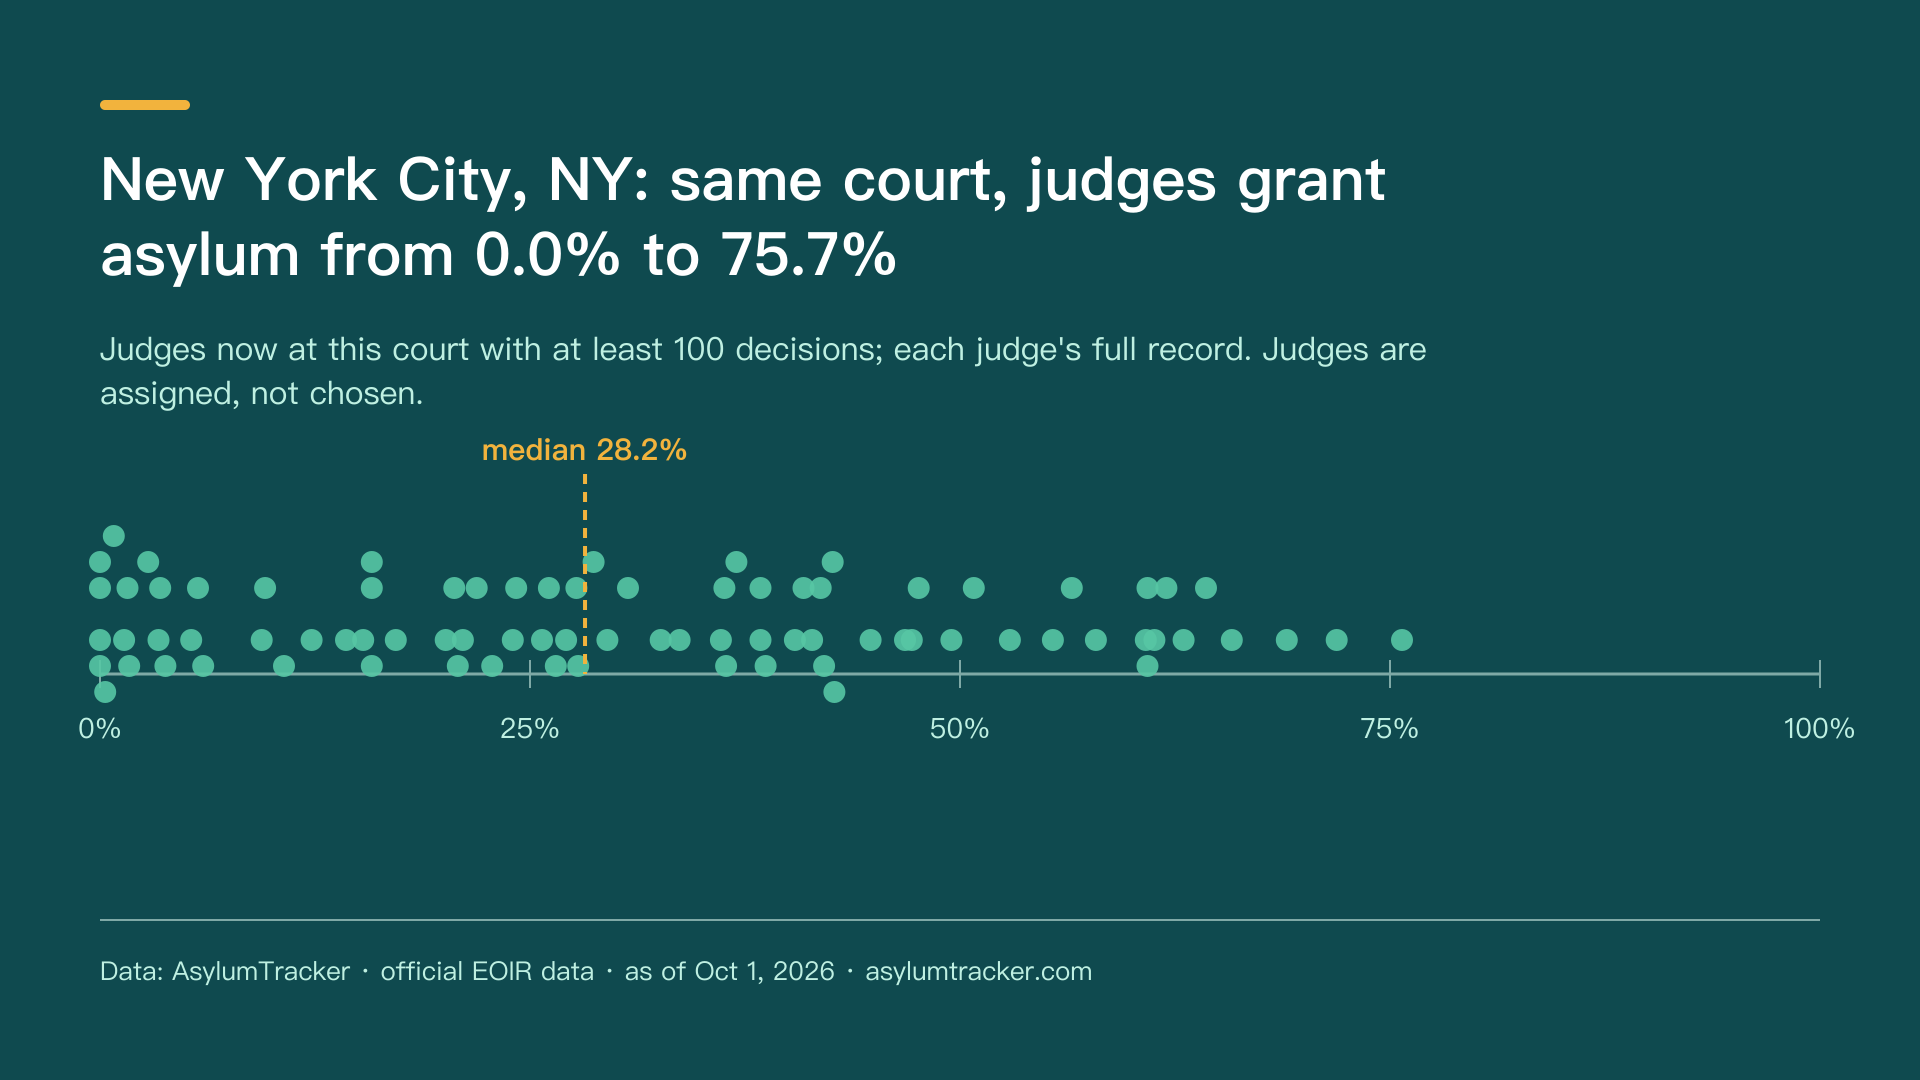
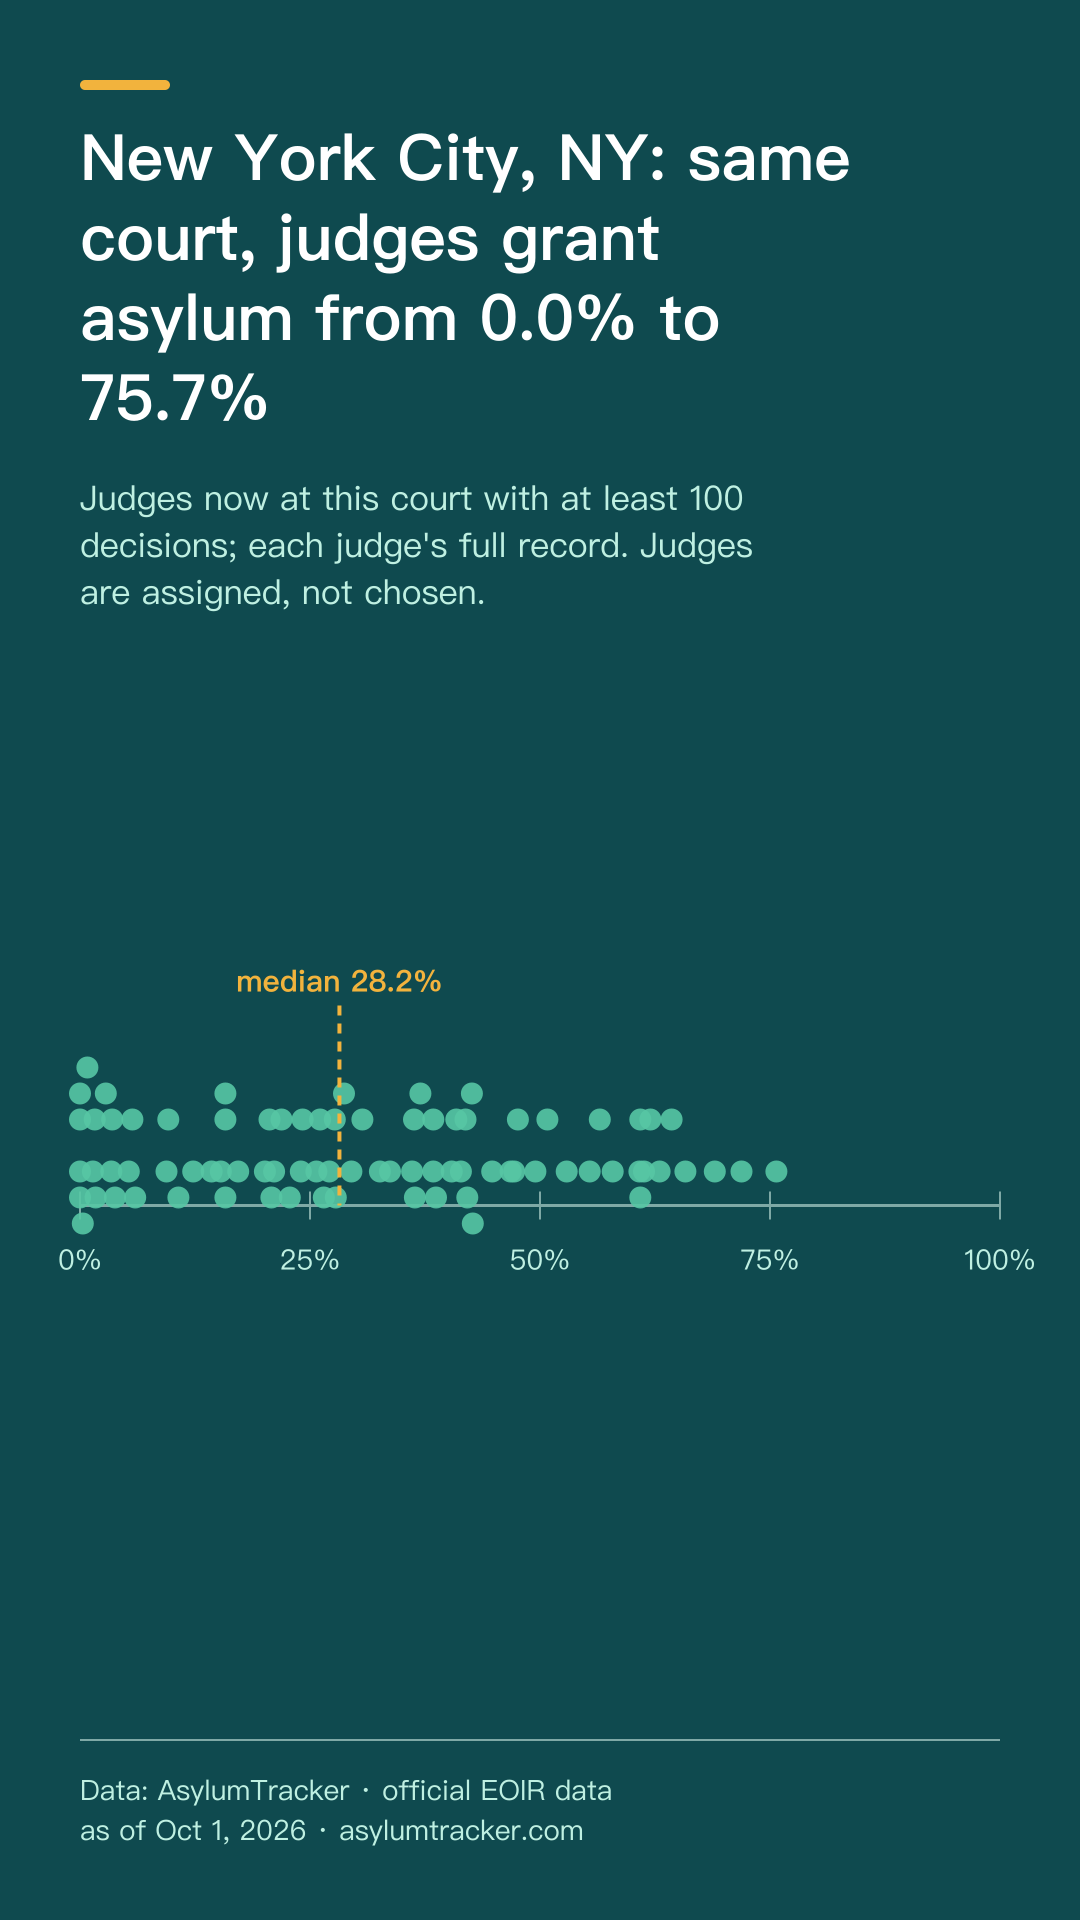
- New York City, NY: same court, judges grant asylum from 0.0% to 75.7%
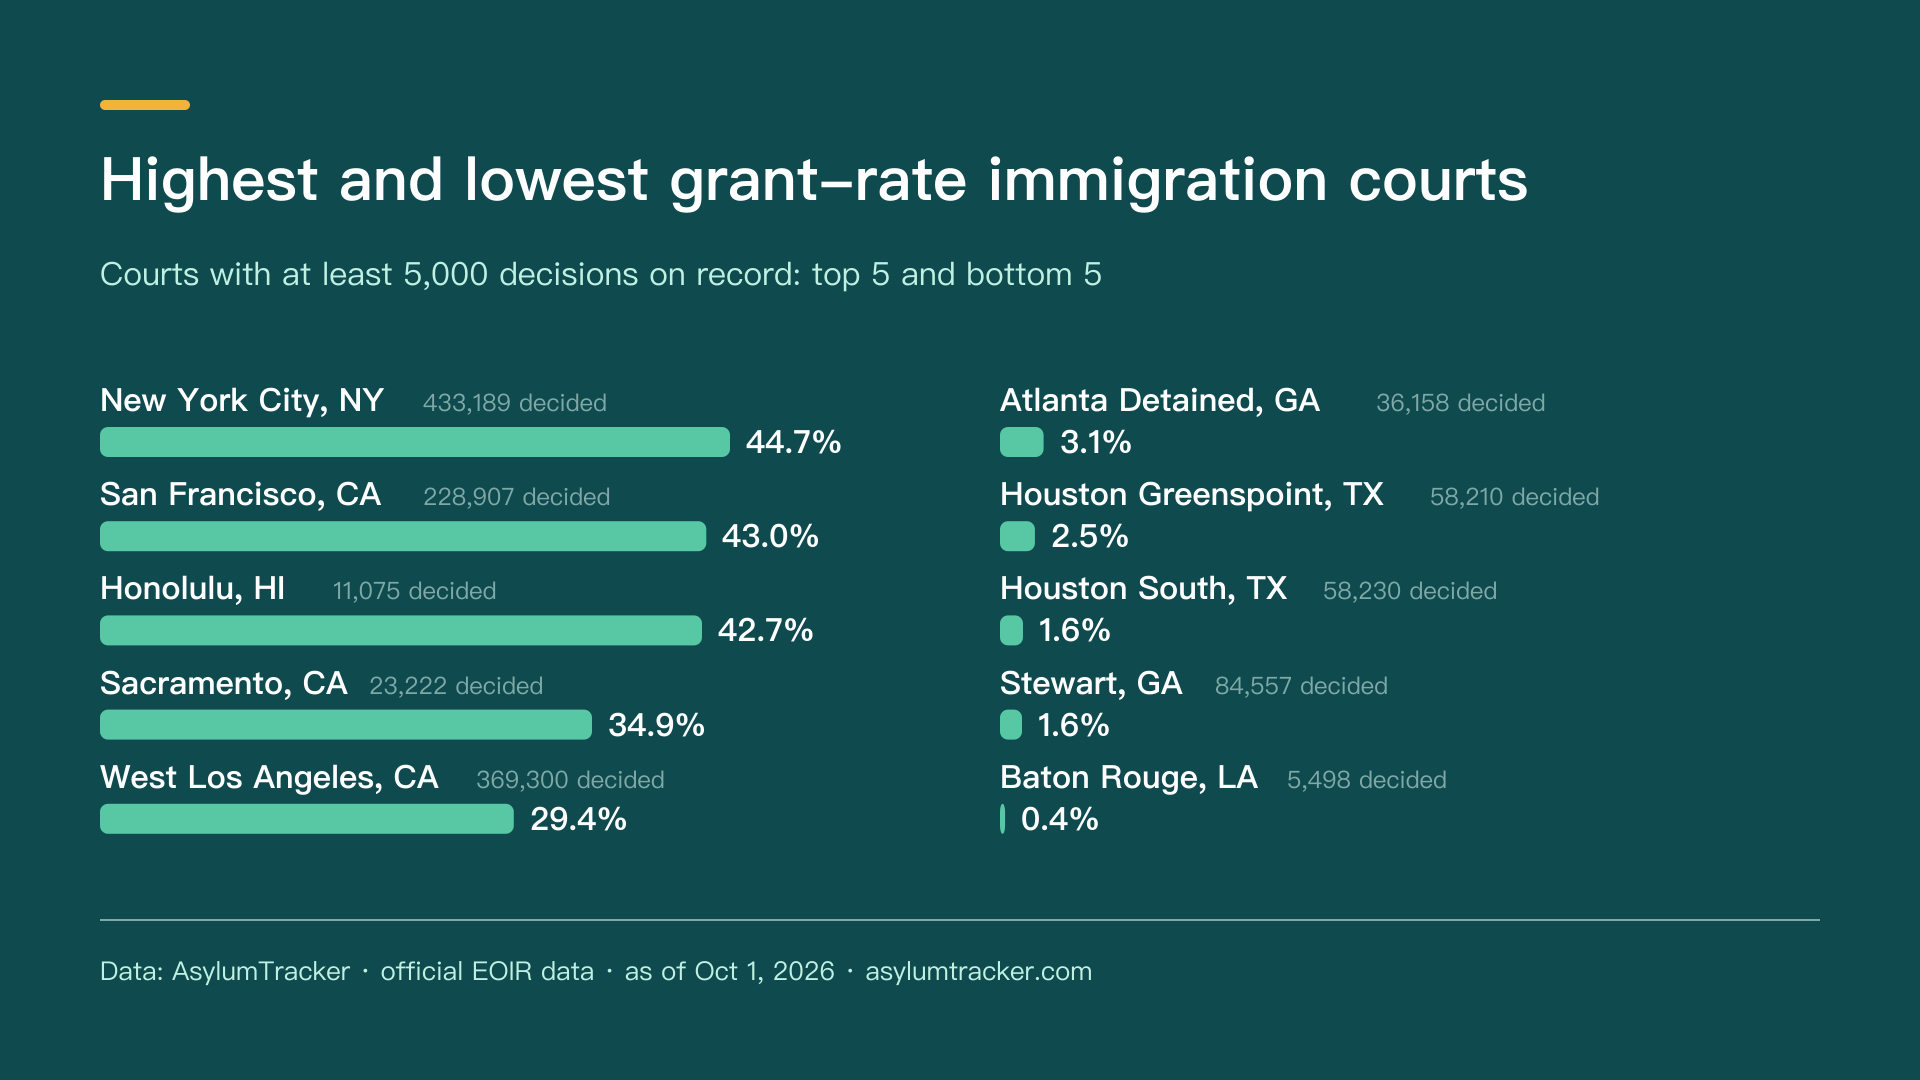
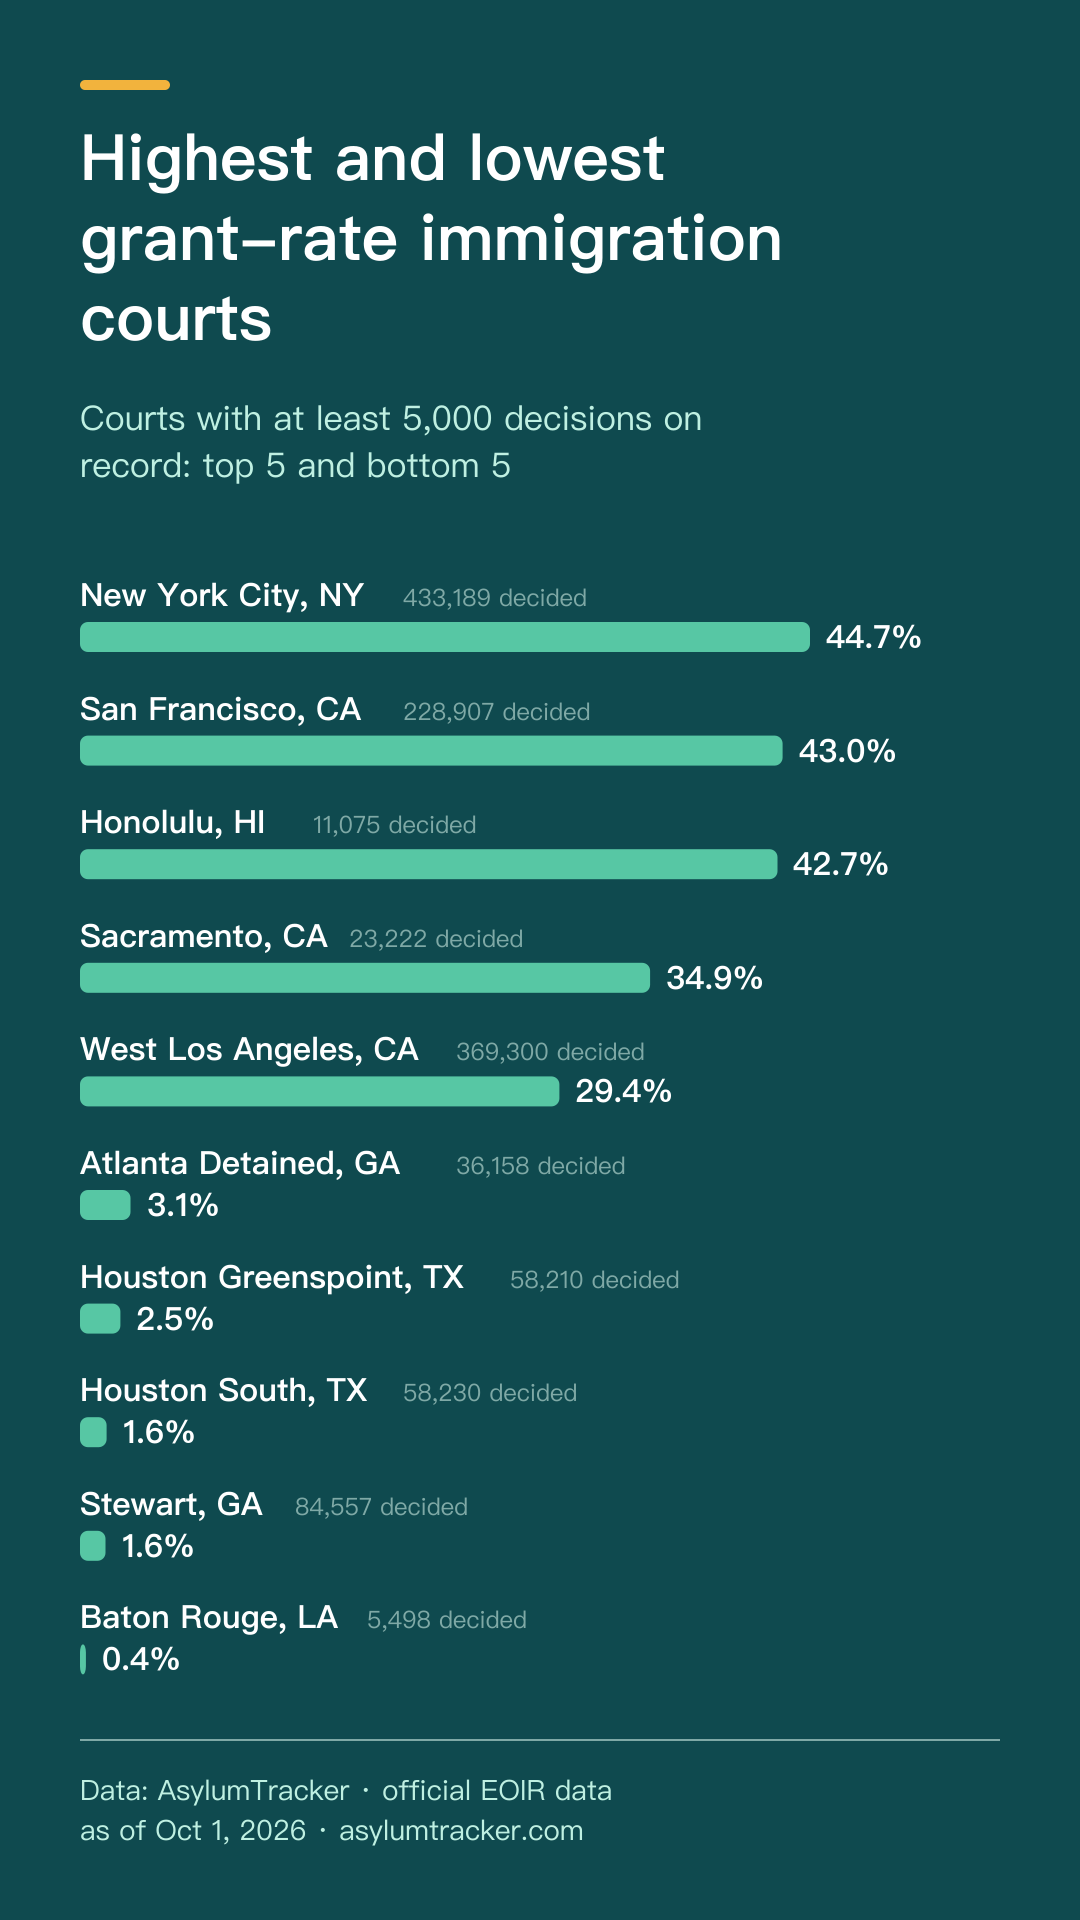
- Highest and lowest grant-rate immigration courts: New York City, NY 44.7%, San Francisco, CA 43.0%, Honolulu, HI 42.7%, Sacramento, CA 34.9%, West Los Angeles, CA 29.4% … Atlanta Detained, GA 3.1%, Houston Greenspoint, TX 2.5%, Houston South, TX 1.6%, Stewart, GA 1.6%, Baton Rouge, LA 0.4%
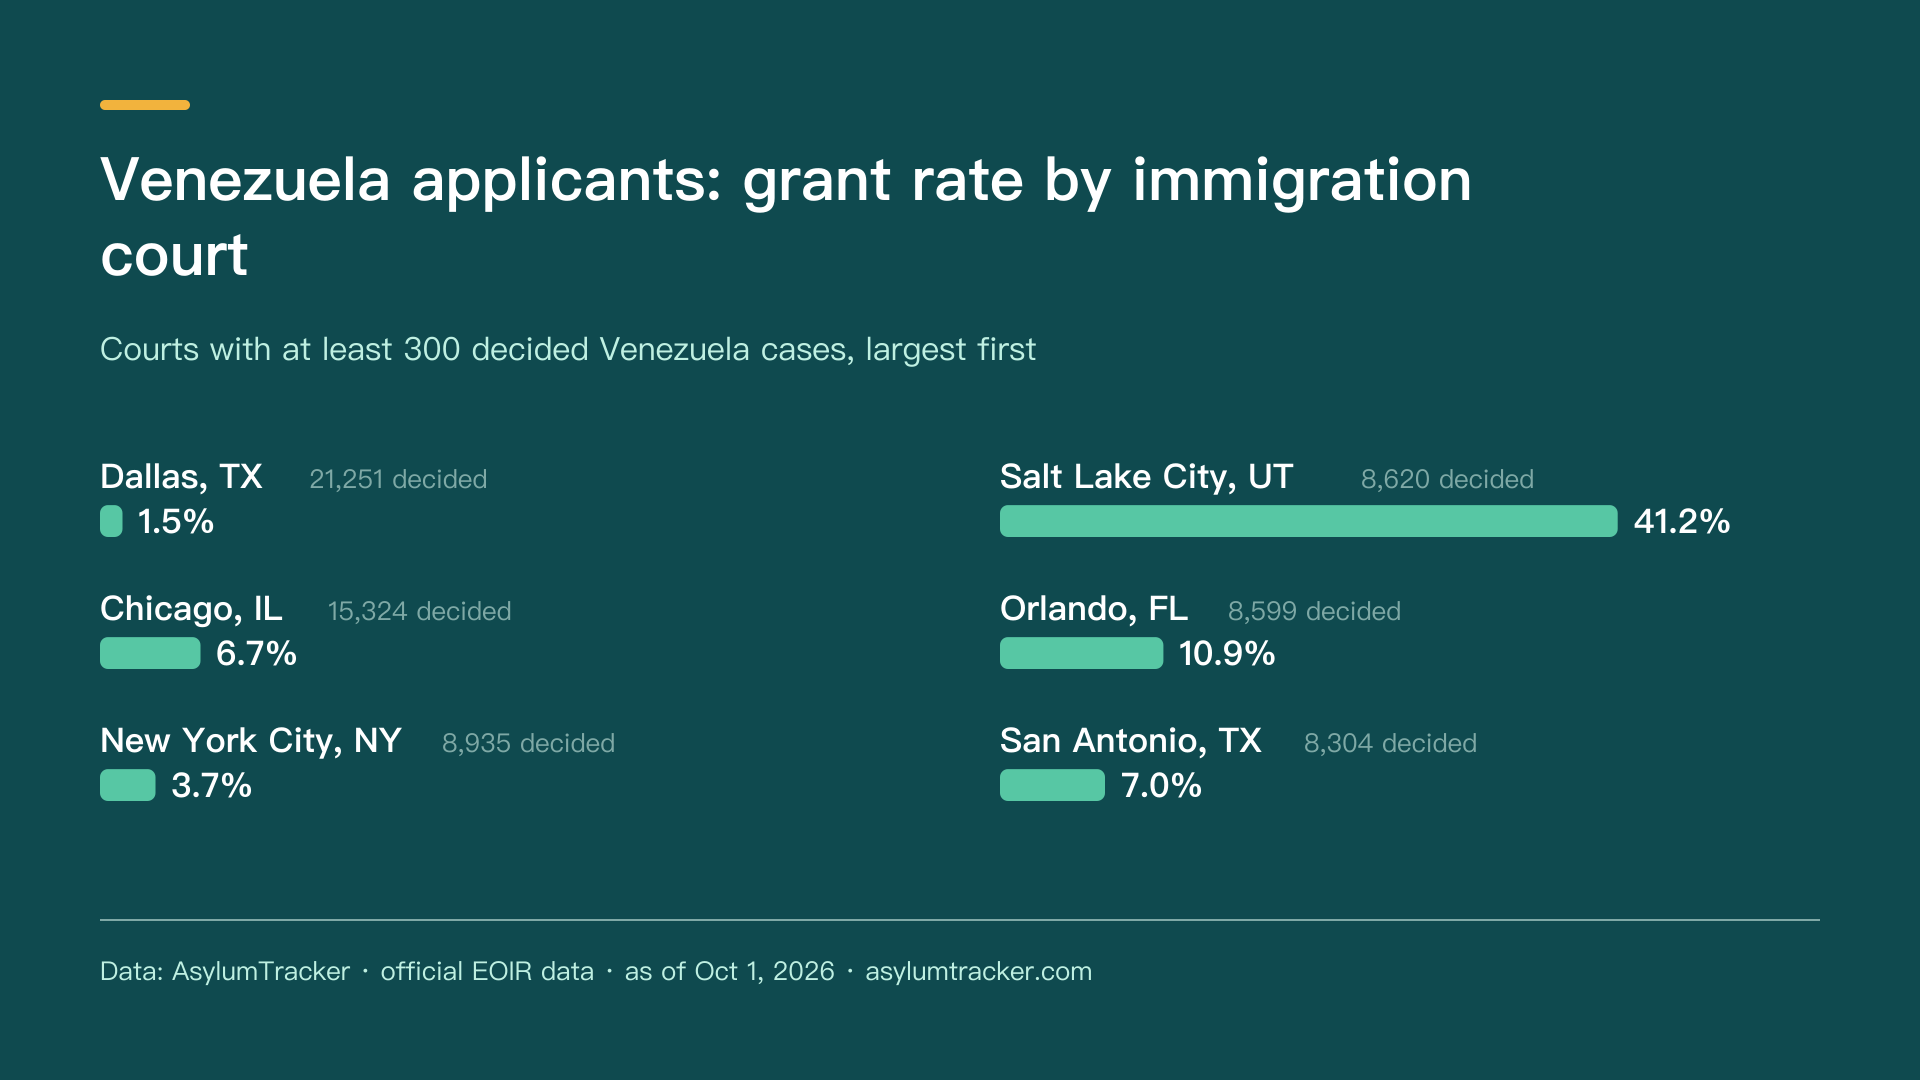
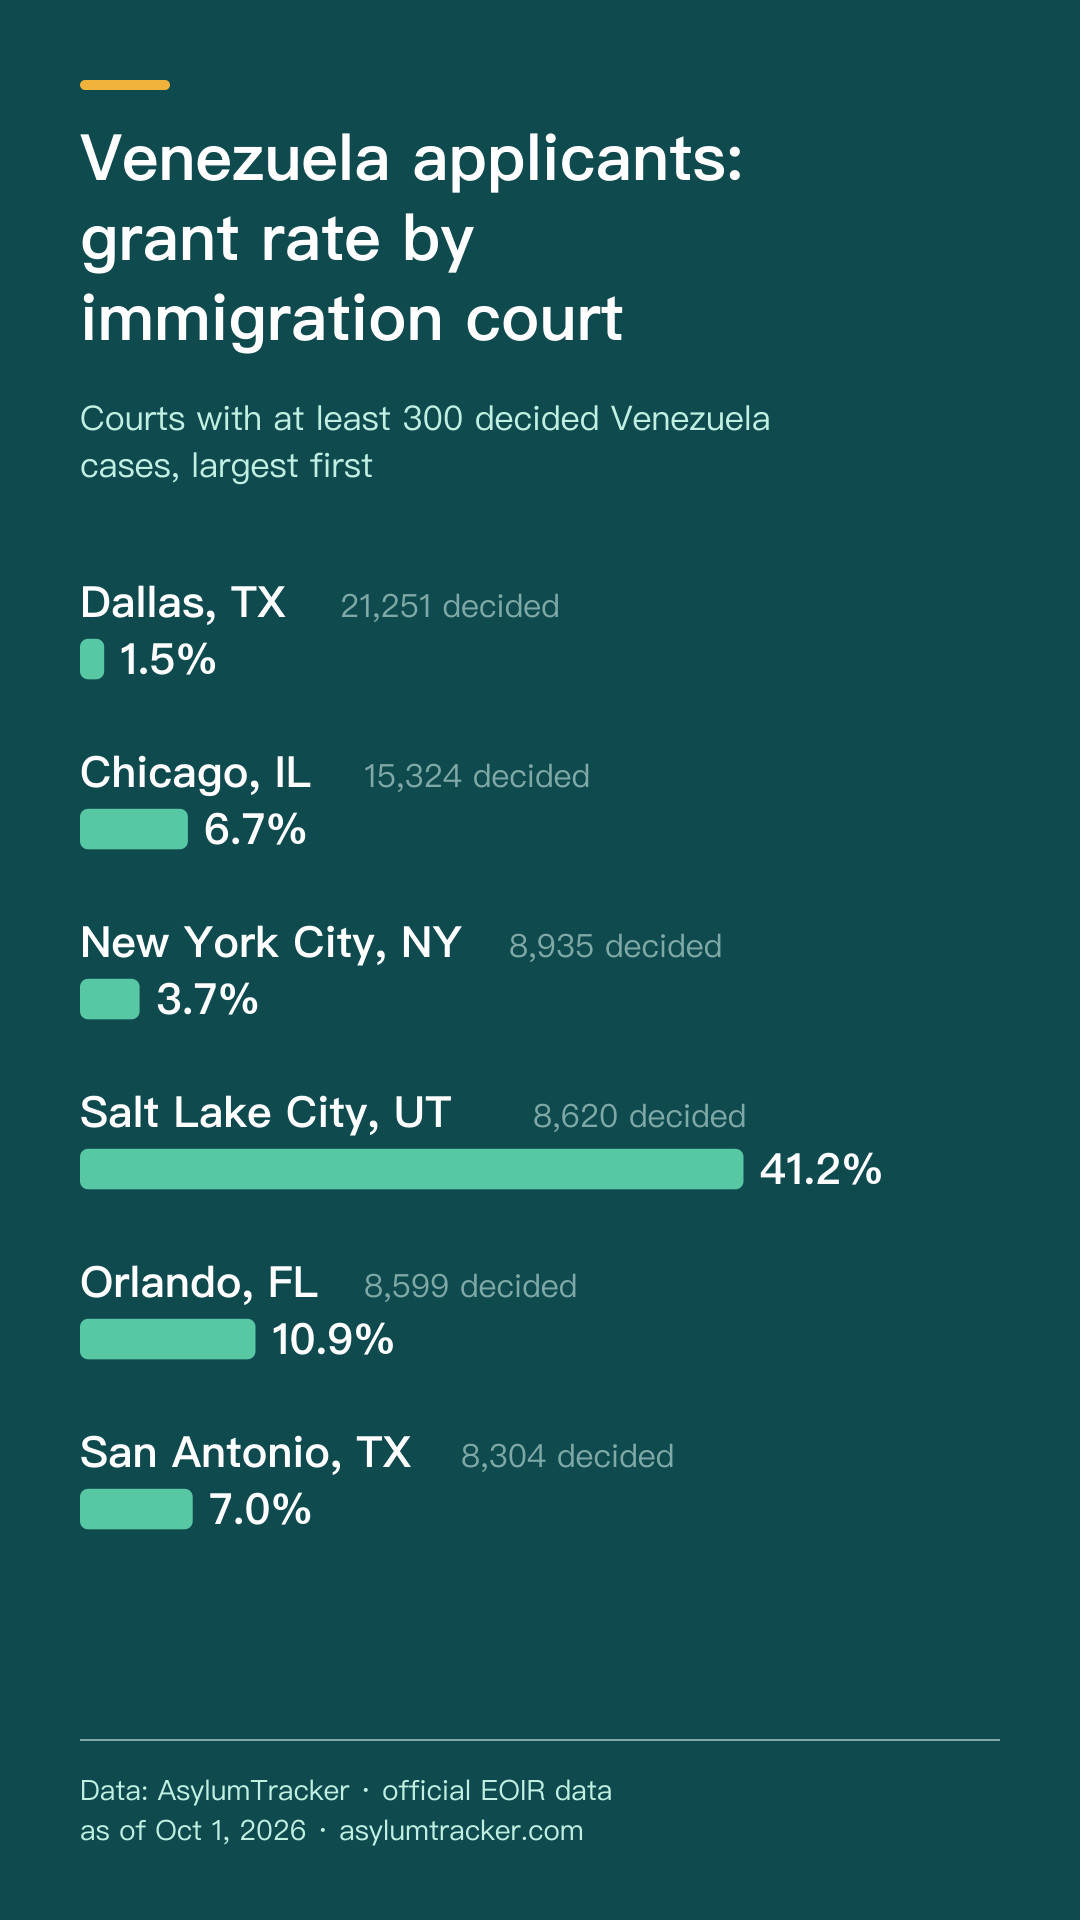
- Venezuela applicants: grant rate by immigration court: Dallas, TX 1.5%, Chicago, IL 6.7%, New York City, NY 3.7%, Salt Lake City, UT 41.2%, Orlando, FL 10.9%, San Antonio, TX 7.0%
Data: AsylumTracker · official EOIR data · as of Oct 1, 2026 · asylumtracker.com
Tables & requests
Need a specific number?
Download the full tables as CSV: grant rates by court · grant rates by nationality. For a custom chart (a court, a judge, a nationality), email [email protected] with the subject “Data request”. How the numbers are calculated: methodology.